Game Walkthroughs and Web Archiving Project Update: Adding Replay Sessions, Performance Results Summary, and Web Archiving Tournament Option to Web Archiving Livestreams

“Game Walkthroughs and Web Archiving” was awarded a grant in the 2021-2022 round of the Discretionary Funding Programme (DFP), the aim of which is to support the collaborative activities of the IIPC members by providing funding to accelerate the preservation and accessibility of the web. The project lead is Michael L. Nelson from the Department of Computer Science at Old Dominion University. Los Alamos National Laboratory Research Library is a project partner. You can learn more about this DFP-funded project at our Dec. 14th IIPC RSS Webinar: Game Walkthroughs and Web Archiving, where Travis Reid will be presenting on his research in greater detail. 


By Travis Reid, Ph.D. student at Old Dominion University (ODU), Michael L. Nelson, Professor in the Computer Science Department at ODU, and Michele C. Weigle, Professor in the Computer Science Department at ODU

The Game Walkthroughs and Web Archiving project focuses on integrating video games with web archiving and applying gaming concepts like speedruns to the web archiving process. We have made some recent updates for this project, which involve adding a replay mode, results mode, and making it possible to have a web archiving tournament during a livestream.      

Replay Mode

Replay mode (Figure 1) is used to show the web pages that were archived during the web archiving livestream and to compare the archived web pages to the live web page. During replay mode, the live web page is shown beside the archived web pages associated with each crawler. The web archiving livestream script scrolls the live web page and archived web pages so that viewers can see the differences between the live web page and the recently archived web pages. In the future when the web archiving livestream supports the use of WARC files from a crawl that was not performed recently, we will compare the archived web pages from the WARC file with a memento from a web archive like Wayback Machine or Arquivo.pt instead of comparing the archived web page against the live web page. For replay mode, we are currently using Webrecorder’s ReplayWeb.page.

Replay_Mode
Figure 1: Replay mode

Replay mode will have an option for viewing annotations created by the web archiving livestream script for the missing resources that were detected (Figure 2). The annotation option was created so that the web archiving livestream would be more like a human driven livestream where the streamer would mention potential reasons why a certain embedded resource is not being replayed properly during the livestream. Another reason for creating the annotation option is so that replay mode can show more than just web pages being scrolled and can provide some information about the elements on a web page that are associated with missing embedded resources. There will also be an option for printing an output file that contains the annotation information created by the web archiving livestream script for the missing embedded resources. For each detected missing resource, this file will include the URI-R for the missing resource, the HTTP response status code, the element that is associated with the resource, and the HTML attribute where the resource’s URI-R is extracted from.

Annotation_option
Figure 2: During replay sessions, there will be an option for automated annotation for the missing resources found on the web page

Results Mode

We have added a results mode (Figure 3) to the web archiving livestream so that viewers can see a summary of the web archiving and replay performance results. This mode is also used to compute the score for each crawler so that we can determine which crawler has won the current round based on the archiving and replay performance. The performance metrics used during results mode is retrieved from the performance result file that is generated after the web archiving and replay sessions. Currently this performance result file includes the number of web pages archived by the crawler during the competition (number of seed URIs), the speedrun completion time for the crawler, the number of resources in the CDXJ file with an HTTP response status code of 404, the number of archived resources categorized by the file type (e.g., HTML, image, video, audio, CSS, JavaScript, JSON, XML, PDF, and fonts), and the number of missing resources categorized by the file type. The performance metrics we are currently using for determining missing and archived resources are temporary and will be replaced with a replay performance metric calculated by the memento damage service. The temporary metrics associated with missing and archived resources are calculated by going through a CDXJ file and counting the number of resources with a 200 status code for the number of archived resources and counting the number of resources with a 404 status code for the number of missing resources. Results mode will allow the viewers to access the performance results file for the round by showing a link or QR code associated with a web page that can dynamically generate the performance results from the current round and allow the viewers to download the performance results file. The web page that is shared with the viewers will also have a button that can navigate them to the video timestamp URL associated with the start of the round, so that viewers who recently joined the livestream can go back and watch the archiving and replay sessions for the current round.

results_mode_SS
Figure 3: Results mode, where the first performance metric is shown which is the speedrun time

Web Archiving Tournaments

A concept that we recently applied to our web archiving livestreams is web archiving tournaments. A web archiving tournament is a competition between four or more crawlers. The web archiving tournaments are currently single elimination tournaments similar to the NFL, NCAA College Basketball, and MLS Cup playoffs, where a team is eliminated from the tournament if they lose a single game. Figure 4 shows an example of teams progressing through our tournament bracket. For each match in a web archiving tournament, there will be two crawlers competing against each other. Each crawler is given the same set of URIs to archive and the set of URIs will be different for each match. The viewers will be able to watch the web archiving and replay sessions for each match. After the replay session is finished, the viewers will see a summary of the web archiving and replay performance results and how the score for each crawler is computed. The crawler with the highest score will be the winner of the match and will progress further in the web archiving tournament. When a crawler loses a match it will not be able to compete in any future matches in the current tournament. The winner of the web archiving tournament will be the crawler that has won every match that it has participated in during the tournament. The web archiving tournament will be updated in the future to support other types of tournaments like double elimination tournament where teams can lose more than once, round robin tournament where teams play each other an equal amount of times, or a combination like the FIFA World Cup that uses round robin for the group stage and single elimination for the knockout phase.

Progressing_Through_Tournament_Bracket
Figure 4: Example of teams progressing through our tournament bracket (in this example, the scores are randomly generated)

Future work

We will apply more gaming concepts to our web archiving livestreams, like having tag-team matches and a single player mode. For a tag-team match, we would have multiple crawlers working together on the same team when archiving a set of URIs. For a single player mode, we could allow the streamer or viewers to select one crawler to use when playing a level.

We are accepting suggestions for video games that will be integrated with our web archiving livestreams and shown during our gaming livestreams. The game must have a mode where we can watch automated gameplay that uses bots (computer players) and there needs to be customization for the bots that can improve the skill level, stats, or abilities for the bot. Call of Duty: Vanguard is an example of a game that can be used during our gaming livestream. In a custom match for Call of Duty: Vanguard, the skill level for the bots can be changed individually for each bot and we can change the number of players added to each team (Figure 5). This game also has other team customization options (Figure 6) that are recommended for games used during our gaming livestream but are not required like being able to change the name of the team and choose the team colors. Call of Duty: Vanguard also has a spectator mode named CoDCaster (Figure 7) where we can watch a match between the bots.

Player_Customization_Annotated
Figure 5: Player customization must allow bots with skill levels that can be changed individually or have abilities that can give a bot an advantage over other bots

Ideal_Team_Customization_Settings_Annotated
Figure 6: Example of team customization that is preferred for team based games used during gaming livestreams, but is optional
spectator_mode
Figure 7: The game must have a spectator option so that we can watch the automated gameplay

An example of a game that will not be used during our gaming livestream is Rocket League. When creating a custom match in Rocket League it is not possible to make one bot have better stats or skills than the other bots in a match. The skill level for the bots in Rocket League is applied to all bots and cannot be individually set for each bot (Figure 8).

Rocket_League_Bot_Difficulty
Figure 8: Rocket League will not be used during our automated gaming livestreams, because their “Bot Difficulty” setting applies the same skill level to all bots

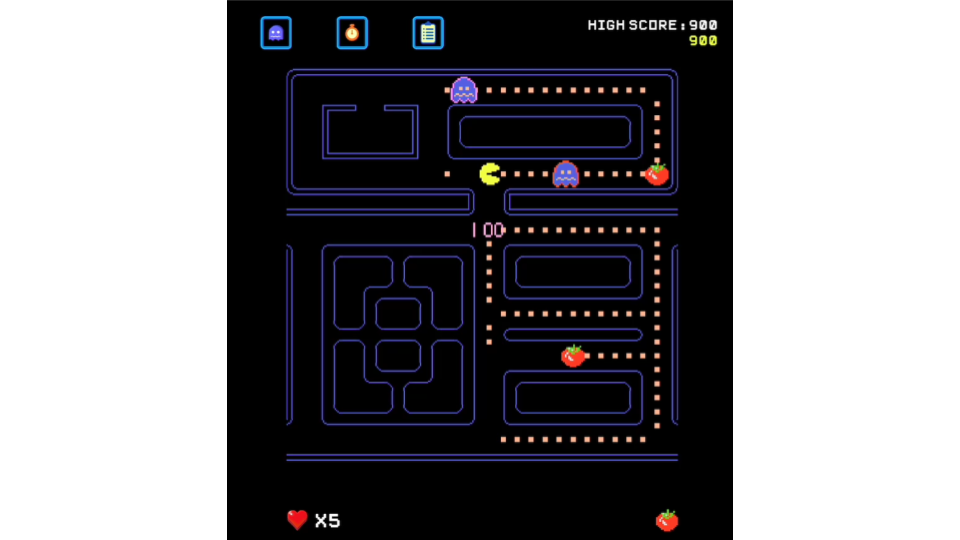
A single player game like Pac-Man also cannot be played during our automated gaming livestream, because a human player is needed in order to play the game (Figure 9). If there are any games that you would like to see during our gaming livestream where we can spectate the gameplay of computer players, then you can use this Google Form to suggest the game.

Pacman_Reduced
Figure 9: Single player games that require a human player to play the game like Pac-Man cannot be used during our automated gaming livestream

Summary

Our recent updates to the web archiving livestreams are adding a replay mode, results mode, and an option for having a web archiving tournament. Replay mode allows the viewers to watch the replay of the web pages that were archived during the web archiving livestream. Results mode shows a summary of the web archiving and replay performance results that were measured during the livestream and shows the match scores for the crawlers. The web archiving tournament option allows us to have a competition between four web archive crawlers and to determine which crawler performed the best during the livestream.

If you have any questions or feedback, you can email Travis Reid at treid003@odu.edu.

Game Walkthroughs and Web Archiving Project: Integrating Gaming, Web Archiving, and Livestreaming 

“Game Walkthroughs and Web Archiving” was awarded a grant in the 2021-2022 round of the Discretionary Funding Programme (DFP), the aim of which is to support the collaborative activities of the IIPC members by providing funding to accelerate the preservation and accessibility of the web. The project lead is Michael L. Nelson from the Department of Computer Science at Old Dominion University. Los Alamos National Laboratory Research Library is a project partner.


By Travis Reid, Ph.D. student at Old Dominion University (ODU), Michael L. Nelson, Professor in the Computer Science Department at ODU, and Michele C. Weigle, Professor in the Computer Science Department at ODU

Introduction

Game walkthroughs are guides that show viewers the steps the player would take while playing a video game. Recording and streaming a user’s interactive web browsing session is similar to a game walkthrough, as it shows the steps the user would take while browsing different websites. The idea of having game walkthroughs for web archiving was first explored in 2013 (“Game Walkthroughs As A Metaphor for Web Preservation”). At that time, web archive crawlers were not ideal for web archiving walkthroughs because they did not allow the user to view the webpage as it was being archived. Recent advancements in web archive crawlers have made it possible to preserve the experience of dynamic web pages by recording a user’s interactive web browsing session. Now, we have several browser-based web archiving tools such as WARCreate, Squidwarc, Brozzler, Browsertrix Crawler, ArchiveWeb.page, and Browsertrix Cloud that allow the user to view a web page while it is being archived, enabling users to create a walkthrough of a web archiving session.

Figure 1
Figure 1: Different ways to participate in gaming (left), web archiving (center), and sport sessions (right)

Figure 1 applies the analogy of different types of video games and basketball scenarios to types of web archiving sessions. Practicing playing a sport like basketball by yourself, playing an offline single player game like Pac-Man, and archiving a web page with a browser extension such as WARCreate are all similar because only one user or player is participating in the session (Figure 1, top row). Playing team sports with a group of people, playing an online multiplayer game like Halo, and collaboratively archiving web pages with Browsertrix Cloud are similar since multiple invited users or players can participate in the sessions (Figure 1, center row). Watching a professional sport on ESPN+, streaming a video game on Twitch, and streaming a web archiving session on YouTube can all be similar because anyone can be a spectator and watch the sporting event, gameplay, or web archiving session (Figure 1, bottom row).

One of our goals in the Game Walkthroughs and Web Archiving project is to create a web archiving livestream like that shown in Figure 1. We want to make web archiving entertaining to a general audience so that it can be enjoyed like a spectator sport. To this end, we have applied a gaming concept to the web archiving process and integrated video games with web archiving. We have created automated web archiving livestreams (video playlist) where the gaming concept of a speedrun was applied to the web archiving process. Presenting the web archiving process in this way can be a general introduction to web archiving for some viewers. We have also created automated gaming livestreams (video playlist) where the capabilities for the in-game characters were determined by the web archiving performance from the web archiving livestream. The current process that we are using for the web archiving and gaming livestreams is shown in Figure 2.

Figure 2
Figure 2: The current process for running our web archiving livestream and gaming livestream.

Web Archiving Livestream

For the web archiving livestream (Figure 2, left side), we wanted to create a livestream where viewers could watch browser-based web crawlers archive web pages. To make the livestreams more entertaining, we made each web archiving livestream into a competition between crawlers to see which crawler performs better at archiving the set of seed URIs. The first step for the web archiving livestream is to use Selenium to set up the browsers that will be used to show information needed for the livestream such as the name and current progress for each crawler. The information currently displayed for a crawler’s progress is the current URL being archived and the number of web pages archived so far. The next step is to get a set of seed URIs from an existing text file and then let each crawler start archiving the URIs. The viewers can then watch the web archiving process in action.

Automated Gaming Livestream

The automated gaming livestream (Figure 2, right side) was created so that viewers can watch a game where the gameplay is influenced by the web archiving and replay performance results from a web archiving livestream or any crawling session. Before an in-game match starts, a game configuration file is needed since it contains information about the selections that will be made in the game for the settings. The game configuration file is modified based on how well the crawlers performed during the web archiving livestream. If a crawler performs well during the web archiving livestream, then the in-game character associated with the crawler will have better items, perks, and other traits. If a crawler performs poorly, then their in-game character will have worse character traits. At the beginning of the gaming livestream, an app automation tool like Selenium (for browser games) or Appium (for locally installed PC games) is used to select the settings for the in-game characters based on the performance of the web crawlers. After the settings are selected by the app automation tool, the match is started and the viewers of the livestream can watch the match between the crawlers’ in-game characters. We have initially implemented this process for two video games, Gun Mayhem 2 More Mayhem and NFL Challenge. However, any game with a mode that does not require a human player could be used for an automated gaming livestream.

Gun Mayhem 2 More Mayhem Demo

Gun Mayhem 2 More Mayhem is similar to other fighting games like Super Smash Bros. and Brawlhalla where the goal is to knock the opponent off the stage. When a player gets knocked off the stage, they lose a life. The winner of the match will be the last player left on the stage. Gun Mayhem 2 More Mayhem is a Flash game that is played in a web browser. Selenium was used to automate this game since it is a browser game. In Gun Mayhem 2 More Mayhem, the crawler’s speed was used to determine which perk to use and the gun to use. Some example perks are infinite ammo, triple jump, and no recoil when firing a gun. The fastest crawler used the fastest gun and was given an infinite ammo perk (Figure 3, left side). The slowest crawler used the slowest gun and did not get a perk (Figure 3, right side).

Figure 3
Figure 3: The character selections made for the fastest and slowest web crawlers

NFL Challenge Demo

NFL Challenge is a NFL Football simulator that was released in 1985 and was popular during the 1980s. The performance of a team is based on the player attributes that are stored in editable text files. It is possible to change the stats for the players, like the speed, passing, and kicking ratings, and it is possible to change the name of the team and the players on the team. This customization allows us to  rename the team to the name of the web crawler and to rename the players of the team to the names of the contributors of the tool. NFL Challenge is a MS-DOS game that can be played with an emulator named DOSBox. Appium was used to automate the game since NFL Challenge is a locally installed game. In NFL Challenge, the fastest crawler would get the team with the fastest players based on the players’ speed attribute (Figure 4, left side) and the other crawler would get the team with the slowest players (Figure 4, right side).

Figure 4
Figure 4: The player attributes for the teams associated with the fastest and slowest web crawlers. The speed ratings are the times for the 40-yard dash, so the lower numbers are faster.

Future Work

In future work, we plan on making more improvements to the livestreams. We will update the web archiving livestreams and the gaming livestreams so that they can run at the same time. The web archiving livestream will use more than the speed of a web archive crawler when determining the crawler’s performance, such as using metrics from Brunelle’s memento damage algorithm which is used to measure the replay quality of archived web pages. During future web archiving livestreams, we will also evaluate and compare the capture and playback of web pages archived by different web archives and archiving tools like the Internet Archive’s Wayback Machine, archive.today, and Arquivo.pt. We will update the gaming livestreams so that they can support more games and games from different genres. The games that we supported so far are multiplayer games. We will also try to automate single player games where the in-game character for each crawler can compete to see which player gets the highest score on a level or which player finishes the level the fastest. For games that allow creating a level or game world, we would like to use what happens during a crawling session to determine how the level is created. If the crawler was not able to archive most of the resources, then more enemies or obstacles could be placed in the level to make it more difficult to complete the level. Some games that we will try to automate include: Rocket League, Brawhalla, Quake, and DOTA 2. When the scripts for the gaming livestream are ready to be released publicly, it will also be possible for anyone to add support for more games that can be automated. We will also have longer runs for the gaming livestreams so that a campaign or season in a game can be completed. A campaign is a game mode where the same characters can play a continuing story until it is completed. A season for the gaming livestreams will be like a season for a sport where there are a certain number of matches that must be completed for each team during a simulated year and a playoff tournament that ends with a championship match.

Summary

We are developing a proof of concept that involves integrating gaming and web archiving. We have integrated gaming and web archiving so that web archiving can be more entertaining to watch and enjoyed like a spectator sport. We have applied the gaming concept of a speedrun to the web archiving process by having a competition between two crawlers where the crawler that finished archiving the set of seed URIs first would be the winner of the competition. We have also created automated web archiving and gaming livestreams where the web archiving performance of web crawlers from the web archiving livestreams were used to determine the capabilities of the characters inside of the Gun Mayhem 2 More Mayhem and NFL Challenge video games that were played during the gaming livestreams. In the future, more nuanced evaluation of the crawling and replay performance can be used to better influence in-game environments and capabilities.

If you have any questions or feedback, you can email Travis Reid at treid003@odu.edu.

Launching LinkGate

By Youssef Eldakar of Bibliotheca Alexandrina

We are pleased to invite the web archiving community to visit LinkGate at linkgate.bibalex.org.

LinkGate is scalable web archive graph visualization. The project was launched with funding by the IIPC in January 2020. During the term of this round of funding, Bibliotheca Alexandrina (BA) and the national Library of New Zealand (NLNZ) partnered together to develop core functionality for a scalable graph visualization solution geared towards web archiving and to compile an inventory of research use cases to guide future development of LinkGate.

What does LinkGate do?

LinkGate seeks to address the need to visualize data stored in a web archive. Fundamentally, the web is a graph, where nodes are webpages and other web resources, and edges are the hyperlinks that connect web resources together. A web archive introduces the time dimension to this pool of data and makes the graph a temporal graph, where each node has multiple versions according to the time of capture. Because the web is big, web archive graph data is big data, and scalability of a visualization solution is a key concern.

APIs and use cases

We developed a scalable graph data service that exposes temporal graph data via an API, a data collection tool for feeding interlinking data extracted from web archive data files into the data service, and a web-based frontend for visualizing web archive graph data streamed by the data service. Because this project was first conceived to fulfill a research need, we reached out to the web archive community and interviewed researchers to identify use cases to guide development beyond core functionality. Source code for the three software components, link-serv, link-indexer, and link-viz, respectively, as well as the use cases, are openly available on GitHub.

Using LinkGate

An instance of LinkGate is deployed on Bibliotheca Alexandrina’s infrastructure and accessible at linkgate.bibalex.org. Insertion of data into the backend data service is ongoing. The following are a few screenshots of the frontend:

  • Graph with nodes colorized by domain
  • Nodes being zoomed in
  • Settings dialog for customizing graph
  • Showing properties for a selected node
  • PathFinder for finding routes between any two nodes

Please see the project’s IIPC Discretionary Funding Program (DFP) 2020 final report for additional details.

We will presenting about the project at the upcoming IIPC Web Archiving Conference on Tuesday, 15 June 2021 and also share the results of our work at an Research Speakers Series webinars on 28 July. If you have any questions or feedback, please contact the LinkGate Team at linkgate[at]iipc.simplelists.com.

Next steps

This development phase of Project LinkGate has been for the core functionality of a scalable, modular graph visualization environment for web archive data. Our team shares a common passion for this work and we remain committed to continuing to build up the components, including:

  • Improved scalability
  • Design and development of the plugin API to support the implementation of add-on finders and vizors (graph exploration tools)
  • Enriched metadata
  • Integration of alternative data stores (e.g., the Solr index in SolrWayback, so that data may be served by link-serv to visualize in link-viz or Gephi)
  • Improved implementation of the software in general.

BA intends to maintain and expand the deploymentat linkgate.bibalex.org on a long-term basis.

Acknowledgements

The LinkGate team is grateful to the IIPC for providing the funding to get the project started and develop the core functionality. The team is passionate about this work and is eager to carry on with development.

LinkGate Team

  • Lana Alsabbagh, NLNZ, Research Use Cases
  • Youssef Eldakar, BA, Project Coordination
  • Mohammed Elfarargy, BA, Link Visualizer (link-viz) & Development Coordination
  • Mohamed Elsayed, BA, Link Indexer (link-indexer)
  • Andrea Goethals, NLNZ, Project Coordination
  • Amr Morad, BA, Link Service (link-serv)
  • Ben O’Brien, NLNZ, Research Use Cases
  • Amr Rizq, BA, Link Visualizer (link-viz)

Additional Thanks

  • Tasneem Allam, BA, link-viz development
  • Suzan Attia, BA, UI design
  • Dalia Elbadry, BA, UI design
  • Nada Eliba, BA, link-serv development
  • Mirona Gamil, BA, link-serv development
  • Olga Holownia, IIPC, project support
  • Andy Jackson, British Library, technical advice
  • Amged Magdey, BA, logo design
  • Liquaa Mahmoud, BA, logo design
  • Alex Osborne, National Library of Australia, technical advice

We would also like to thank the researchers who agreed to be interviewed for our Inventory of Use Cases.


Resources

IIPC-supported project “Developing Bloom Filters for Web Archives’ Holdings”

By Martin Klein, Scientist in the Research Library at Los Alamos National Laboratory and Karolina Holub, Library Adviser at the Croatian Digital Library Development Centre at  National and University Library Zagreb

We are excited to share the news of a newly IIPC-funded collaborative project between the Los Alamos National Laboratory (LANL) and the National and University Library Zagreb (NSK). In this one-year project we will develop a software framework for web archives to create Bloom filters of their archival holdings. A Bloom filter, in this context, consists of hash values of archived URIs and can therefore be thought of as an encrypted index of an archive’s holdings. Its encrypted nature allows web archives to share information about their holdings in a passive manner, meaning only hashed URI values are communicated, rather than plain text URIs. Sharing Bloom filters with interested parties can enable a variety of down-stream applications such as search, synchronized crawling, and cataloging of archived resources.

Bloom filters and Memento TimeTravel

As many readers of this blog will know, the Prototyping Team at LANL has developed and maintained the Memento TimeTravel service, implemented as a federated search across more than two dozen memento-compliant web archives. This service therefore allows a user (or a machine via the underlying APIs) to search for archived web resources (mementos) across many web archives at the same time. We have tested, evaluated, and implemented various optimizations for the search system to improve speed and avoid unnecessary network requests against participating web archives but we can always do better. As part of this project, we aim at piloting a TimeTravel service based on Bloom filters, that, if successful, should provide close to an ideal false positive rate, meaning almost no unnecessary network requests to web archives that do not have a memento of the requested URI.

While Bloom filters are widely used to support membership queries (e.g., is element A part of set B?), it has, to the best of our knowledge, not been applied to query web archive holdings. We are aware of opportunities to improve the filters and, as additional components of this project, will investigate their scalability (in relation to CDX index size, for example) as well as the potential for incremental updates to the filters. Insights into the former will inform the applicability for different size archives and individual collections and the latter will guide a best practice process of filter creation.

The development and testing of Bloom filters will be performed by using data from the Croatian Web Archive’s collections. NSK develops the Croatian Web Archive (HAW) in collaboration with the University Computing Centre University of Zagreb (Srce), which is responsible for technical development and will work closely with LANL and NSK on this project.

LANL and NSK are excited about this project and new collaboration. We are thankful to the IIPC and their support and are looking forward to regularly sharing project updates with the web archiving community. If you would like to collaborate on any aspects of this project, please do not hesitate and get in touch.

The Dark and Stormy Archives Project: Summarizing Web Archives Through Social Media Storytelling

By Shawn M. Jones, Ph.D. student and Graduate Research Assistant at Los Alamos National Laboratory (LANL), Martin Klein, Scientist in the Research Library at LANL, Michele C. Weigle, Professor in the Computer Science Department at Old Dominion University (ODU), and Michael L. Nelson, Professor in the Computer Science Department at ODU.

The Dark and Stormy Archives Project applies social media storytelling to automatically summarize web archive collections in a format that readers already understand.

Individual web archive collections can contain thousands of documents. Seeds inform capture, but the documents in these collections are archived web pages (mementos) created from those seeds. The sheer size of these collections makes them challenging to understand and compare. Consider Archive-It as an example platform. Archive-It has many collections on the same topic. As of this writing, a search for the query “COVID” returns 215 collections. If a researcher wants to use one of these collections, which one best meets their information need? How does the researcher differentiate them? Archive-It allows its collection owners to apply metadata, but our 2019 study found that as a collection’s number of seeds rises, the amount of metadata per seed falls. This relationship is likely due to the increased effort required to maintain the metadata for a growing number of seeds. It is paradoxical for those viewing the collection because the more seeds exist, the more metadata they need to understand the collection. Additionally, organizations add more collections each year, resulting in more than 15,000 Archive-It collections as of the end of 2020. Too many collections, too many documents, and not enough metadata make human review of these collections a costly proposition.

We use cards to summarize web documents all of the time. Here is the same document rendered as cards on different platforms.

An example of social media storytelling at Storify (now defunct) and Wakelet: cards created from individual pages, pictures, and short text describe a topic.

Ideally, a user would be able to glance at a visualization and gain understanding of the collection, but existing visualizations require a lot of cognitive load and training even to convey one aspect of a collection. Social media storytelling provides us with an approach. We see social cards all of the time on social media. Each card summarizes a single web resource. If we group those cards together, we summarize a topic. Thus social media storytelling produces a summary of summaries. Tools like Storify and Wakelet already apply this technique for live web resources. We want to use this proven technique because readers already understand how to view these visualizations. The Dark and Stormy Archives (DSA) Project explores how to summarize web archive collections through these visualizations. We make our DSA Toolkit freely available to others so they can explore web archive collections through storytelling.

The Dark and Stormy Archives Toolkit

The Dark and Stormy Archives (DSA) Toolkit provides a solution for each stage of the storytelling lifecycle.

Telling a story with web archives consists of three steps. First, we select the mementos for our story. Next, we gather the information to summarize each memento. Finally, we summarize all mementos together and publish the story. We evaluated more than 60 platforms and determined that no platform could reliably tell stories with mementos. Many could not even create cards for mementos, and some mixed information from the archive with details from the underlying document, creating confusing visualizations.

Hypercane selects the mementos for a story. It is a rich solution that gives the storyteller many customization options. With Hypercane, we submit a collection of thousands of documents, and Hypercane reduces them to a manageable number. Hypercane provides commands that allow the archivist to cluster, filter, score, and order mementos automatically. The output from some Hypercane commands can be fed into others so that archivists can create recipes with the intelligent selection steps that work best for them. For those looking for an existing selection algorithm, we provide random selection, filtered random selection, and AlNoamany’s Algorithm as prebuilt intelligent sampling techniques. We are experimenting with new recipes. Hypercane also produces reports, helping us include named entities, gather collection metadata, and select an overall striking image for our story.

To gather the information needed to summarize individual mementos, we required an archive-aware card service; thus, we created MementoEmbed. MementoEmbed can create summaries of individual mementos in the form of cards, browser screenshots, word clouds, and animated GIFs. If a web page author needs to summarize a single memento, we provide a graphical user interface that returns the proper HTML for them to embed in their page. MementoEmbed also provides an extensive API on top of which developers can build clients.

Raintale is one such client. Raintale summarizes all mementos together and publishes a story. An archivist can supply Raintale with a list of mementos. For more complex stories, including overall striking images and metadata, archivists can also provide output from Hypercane’s reports. Because we needed flexibility for our research, we incorporated templates into Raintale. These templates allow us to publish stories to Twitter, HTML, and other file formats and services. With these temples, an archivist can not only choose what elements to include in their cards; they can also brand the output for their institution.

Raintale uses templates to allow the storyteller to tell their story in different formats, with various options, including branding.

The DSA Toolkit at work

The DSA Toolkit produced stories from Archive-It collections about mass shootings (from left to right) at Virginia TechNorway, and El Paso.


Through these tools, we have produced a variety of stories from web archives. As shown above, we debuted with a story summarizing IIPC’s COVID-19 Archive-It collection, summarizing a collection of 23,376 mementos as an intelligent sample of 36. Instead of seed URLs and metadata, our visualization displays people in masks, places that the virus has affected, text drawn from the underlying mementos, correct source attribution, and, of course, links back to the Archive-It collection so that people can explore the collection further. We recently generated stories that would allow readers to view the differences between Archive-It collections about the mass shootings in Norway, El Paso, and Virginia Tech. Instead of facets and seed metadata, our stories show victims, places, survivors, and other information drawn from the sampled mementos. The reader can also follow the links back to the full collection page and get even more information using the tools provided by the archivists at Archive-It.

With help from StoryGraph, the DSA Toolkit produces daily news stories so that readers can compare the biggest story of the day across different years.

But our stories are not just limited to Archive-It. We designed the tools to work with any Memento-compliant web archive. In collaboration with Storygraph, we produce daily news stories built with mementos stored at Archive.Today and the Internet Archive. We are also experimenting with summarizing a scholar’s grey literature as stored in the web archive maintained by the Scholarly Orphans project.

We designed the DSA Toolkit to work with any Memento-compliant archive. Here we summarize Ian Milligan’s grey literature as captured by the web archive at the Scholarly Orphans Project.

Our Thanks To The IIPC For Funding The DSA Toolkit

We are excited to say that, starting in 2021, as part of a recent IIPC grant, we will be working with the National Library of Australia to pilot the DSA Toolkit with their collections. In addition to solving potential integration problems with their archive, we look forward to improving the DSA Toolkit based on feedback and ideas from the archivists themselves. We will incorporate the lessons learned back into the DSA Toolkit so that all web archives may benefit, which is what the IIPC is all about.

Relevant URLs

DSA web site: http://oduwsdl.github.io/dsa

DSA Toolkit: https://oduwsdl.github.io/dsa/software.html

Raintale web site: https://oduwsdl.github.io/raintale/

Hypercane web site: https://oduwsdl.github.io/hypercane/

LinkGate: Initial web archive graph visualization demo

By Mohammed Elfarargy and Youssef Eldakar of Bibliotheca Alexandrina

LinkGate is an IIPC-funded project to develop a scalable web archive graph visualization environment and collect research use cases, led by Bibliotheca Alexandrina (BA) and the National Library of New Zealand (NLNZ). The project provides three modular components:

  • Link Service (link-serv) for the scalable temporal graph data service with an underlying graph data store and API
  • Link Indexer (link-indexer) for collecting inter-linking data from the web archive

  • Link Visualizer (link-viz) for the web-based frontend geared towards web archive graph data navigation and exploration

Research use cases are being documented to guide future development.

You can read more about our work in the blog post published in April.

During a webinar held at the end of July as part of the IIPC Research Speaker Series (RSS), we presented a demo of the tools being developed and a summary of feedback gathered so far from the community towards a research use case inventory. In this blog post, we give an update on progress of the technical development, focusing on the initial UI of link-viz.

Link Visualizer

LinkGate’s frontend visualization component, link-viz, has developed on many fronts over the last four months. While the LinkServe component is compatible with the Gephi streaming API, Gephi remains a desktop-only general-purpose graph visualization tool. link-viz, on the other hand, is a web-based, scalable graph visualization tool that is made specifically to visualize web archive graph data. This makes it possible to produce more informative graphs for web archive users.

link-viz works in a similar manner to web-based map services like Google Maps. The user gets a graph based on the queried URL and the desired snapshot. Users can set the initial depth of the graph and then incrementally add more nodes as they explore deeper in the graph. This smart loading makes the exploration of such a dense graph run more smoothly.

The link-viz UI is designed to set the main focus on the graph. Users can click on any graph node to select it and perform actions using tools available in the UI. Graph nodes can be moved around and are, by default, distributed using a spring force model to help make a uniform distribution over 2D space. It’s possible to toggle this off to give users the option to organize nodes manually. Users can easily pan and zoom in/out the view using mouse controls or touch gestures. All other tools are located in four floating panels surrounding the main graph area:

The left-hand panel is used to search for a URL and to select the desired snapshot based on which the initial graph will be rendered. The snapshot selection widget is illustrated in Figure 1:

Figure 1: Snapshot selection widget

The bottom panel shows detailed information on the highlighted graph node. This includes a full URL and a listing of all the outlinks and inlinks. This can be seen in Figure 2:

Figure 2: Node details panel

The top panel contains a set of tools for graph navigation (zoom in/out and reset view), taking graph screenshots, setting graph depth, collapsing/expanding portions of the graph, and configuring the look of the graph (selection of color, size, and shape for both graph nodes and edges to represent different pieces of information). One nice feature of link-viz compared to standard graph visualization tools is the usage of website favicons for graph nodes instead of geometric shapes, which makes nodes instantly identifiable and results in a much more readable graph. Figures 3 and 4 show the top panel and favicon usage, respectively:

Figure 3: Top panel


Figure 4: Favicons for graph nodes

The right-hand panel contains two tabs reserved for two sets of tools, Vizors and Finders. Vizors are tools to display the same graph highlighting additional information. Two vizors are currently planned. The GeoVizor will put graph nodes on top of a world map to show the hosting physical location. The FileTypeVizor will display file-type icons as graph nodes, making it very easy to identify most common file types and their distribution over the web. Finders perform graph exploration functions, such as finding loops or paths between nodes.

Apart from Vizors and Finders, we are also working on other features, including smart graph loading and animated graph timeline. We are also going to improve UI styling.

Link Indexer

link-indexer is now integrated with link-serv via the API. We have been testing the process of inserting data extracted with link-indexer into link-serv to identify data and scalability problems to work on. link-indexer now accepts command-line options for specifying the target link-serv instance and controlling the insertion batch size to manage how often the API is invoked. More command-line options are being added to control various aspects of the tool, as well as the ability to load options from a configuration file. We are also working to enhance tolerance to data issues, such as very long URLs, and network issues, such as short service outages. Figure 5 shows a sample output from a link-indexer run:

Figure 5: Sample output from a link-indexer run

Link Service

link-serv implements an API for link-indexer and link-viz to communicate with the graph data store. The API is compatible with the Gephi streaming API, giving users the option to connect to link-serv using the popular graph visualization tool, Gephi, as an alternative to the project’s frontend, link-viz.  Figure 6 shows a Gephi client streaming graph data from a link-serv instance:

Figure 6: Gephi client streaming from a link-serv instance

A data schema customized for temporal, versioned web archive data is used in the underlying Neo4j graph data store, and link-serv defines extra API operations not defined in the Gephi streaming API to support temporal navigation functionality in link-viz.

As more data is added to link-serv, the underlying graph data store has difficulty scaling up when reliant on a single instance. Our primary focus in link-serv at the moment, therefore, is to implement clustering. Work is in progress on a customized dispatcher service for the Neo4j graph data store as a substitute to clustering functionality in the commercially licensed Neo4j Enterprise Edition. As a side track, we are also looking into ArangoDB as possibly an alternative deployment option for link-serv’s graph data store.

Asking questions with web archives – introductory notebooks for historians

“Asking questions with web archives – introductory notebooks for historians” is one of three projects awarded a grant in the first round of the Discretionary Funding Programme (DFP) the aim of which is to support the collaborative activities of the IIPC members by providing funding to accelerate the preservation and accessibility of the web. The project was led by Dr Andy Jackson of the British Library. The project co-lead and developer was Dr Tim Sherratt, the creator of the GLAM Workbench, which provides researchers with examples, tools, and documentation to help them explore and use the online collections of libraries, archives, and museums. The notebooks were developed with the participation of the British Library (UK Web Archive), the National Library of Australia (Australian Web Archive), and the National Library of New Zealand (the New Zealand Web Archive).


By Tim Sherratt, Associate Professor of Digital Heritage, University of Canberra & the creator of the GLAM Workbench

We tend to think of a web archive as a site we go to when links are broken – a useful fallback, rather than a source of new research data. But web archives don’t just store old web pages, they capture multiple versions of web resources over time. Using web archives we can observe change – we can ask historical questions. But web archives store huge amounts of data, and access is often limited for legal reasons. Just knowing what data is available and how to get to it can be difficult.

Where do you start?

The GLAM Workbench’s new web archives section can help! Here you’ll find a collection of Jupyter notebooks that  document web archive data sources and standards, and walk through methods of harvesting, analysing, and visualising that data. It’s a mix of examples, explorations, apps and tools. The notebooks use existing APIs to get data in manageable chunks, but many of the examples demonstrated can also be scaled up to build substantial datasets for research – you just have to be patient!

What can you do?

Have you ever wanted to find when a particular fragment of text first appeared in a web page? Or compare full-page screenshots of archived sites? Perhaps you want to explore how the text content of a page has changed over time, or create a side-by-side comparison of web archive captures. There are notebooks to help you with all of these. To dig deeper you might want to assemble a dataset of text extracted from archived web pages, construct your own database of archived Powerpoint files, or explore patterns within a whole domain.

A number of the notebooks use Timegates and Timemaps to explore change over time. They could be easily adapted to work with any Memento compliant system. For example, one notebook steps through the process of creating and compiling annual full-page screenshots into a time series.

Using screenshots to visualise change in a page over time.

Another walks forwards or backwards through a Timemap to find when a phrase first appears in (or disappears from) a page. You can also view the total number of occurrences over time as a chart.


Find when a piece of text appears in an archived web page.

The notebooks document a number of possible workflows. One uses the Internet Archive’s CDX API to find all the Powerpoint files within a domain. It then downloads the files, converts them to PDFs, saves an image of the first slide, extracts the text, and compiles everything into an SQLite database. You end up with a searchable dataset that can be easily loaded into Datasette for exploration.

Find and explore Powerpoint presentations from a specific domain.

While most of the notebooks work with small slices of web archive data, one harvests all the unique urls from the gov.au domain and makes an attempt to visualise the subdomains. The notebooks provide a range of approaches that can be extended or modified according to your research questions.

Visualising subdomains in the gov.au domain as captured by the Internet Archive.

Acknowledgements

Thanks to everyone who contributed to the discussion on the IIPC Slack, in particular Alex Osborne, Ben O’Brien and Andy Jackson who helped out with understanding how to use NLA/NZNL/UKWA collections respectively.

Resources:

LinkGate: Let’s build a scalable visualization tool for web archive research

By Youssef Eldakar of Bibliotheca Alexandrina and Lana Alsabbagh of the National Library of New Zealand

Bibliotheca Alexandrina (BA) and the National Library of New Zealand (NLNZ) are working together to bring to the web archiving community a tool for scalable web archive visualization: LinkGate. The project was awarded funding by the IIPC for the year 2020. This blog post gives a detailed overview of the work that has been done so far and outlines what lies ahead.


In all domains of science, visualization is essential for deriving meaning from data. In web archiving, data is linked data that may be visualized as graph with web resources as nodes and outlinks as edges.

This phase of the project aims to deliver the core functionality of a scalable web archive visualization environment consisting of a Link Service (link-serv), Link Indexer (link-indexer), and Link Visualizer (link-viz) components as well as to document potential research use cases within the domain of web archiving for future development.

The following illustrates data flow for LinkGate in the web archiving ecosystem, where a web crawler archives captured web resources into WARC/ARC files that are then checked into storage, metadata is extracted from WARC/ARC files into WAT files, link-indexer extracts outlink data from WAT files and inserts it into link-serv, which then serves graph data to link-viz for rendering as the user navigates the graph representation of the web archive:

LinkGate: data flow

In what follows, we look at development by Bibliotheca Alexandrina to get each of the project’s three main components, Link Service, Link Indexer and Link Visualizer, off the ground. We also discuss the outreach part of the project, coordinated  by the National Library of New Zealand, which involves gathering researcher input and putting together an inventory of use cases.

Please watch the project’s code repositories on GitHub for commits following a code review later this month:

Please see also the Research Use Cases for Web Archive Visualization wiki.

Link Service

link-serv is the Link Service that provides an API for inserting web archive interlinking data into a data store and for retrieving back that data for rendering and navigation.
We worked on the following:

  • Data store scalability
  • Data schema
  • API definition and and Gephi compatibility
  • Initial implementation

Data store scalability

link-serv depends on an underlying graph database as repository for web resources as nodes and outlinks as relationships. Building upon BA’s previous experience with graph databases in the Encyclopedia of Life project, we worked on adapting the Neo4j graph database for versioned web archive data. Scalability being a key interest, we ran a benchmark of Neo4j on Intel Xeon E5-2630 v3 hardware using a generated test dataset and examined bottlenecks to tune performance. In the benchmark, over a series of progressions, a total of 15 billion nodes and 34 billion relationships were loaded into Neo4j, and matching and updating performance was tested. And while time to insert nodes into the database for the larger progressions was in hours or even days, match and update times in all progressions after a database index was added, remained in seconds, ranging from 0.01 to 25 seconds for nodes, with 85% of cases remaining below 7 seconds and 0.5 to 34 seconds for relationships, with 67% of cases remaining below 9 seconds. Considering the results promising, we hope that tuning work during the coming months will lead to more desirable performance. Further testing is underway using a second set of generated relationships to more realistically simulate web links.

We ruled out Virtuoso, 4store, and OrientDB as graph data store options for being less suitable for the purposes of this project. A more recent alternative, ArangoDB, is currently being looked into and is also showing promising initial results, and we are leaving open the possibility of additionally supporting it as an option for the graph data store in link-serv.

Data schema

To represent web archive data in the graph data store, we designed a schema with the goals of supporting time-versioned interlinked web resources and being friendly to search using the Cypher Query Language. The schema defines Node and VersionNode as node types and HAS_VERSION and LINKED_TO as relationship types linking a Node to a descendant VersionNode and a VersionNode to a hyperlinked Node, respectively. A Node has the URI of the resource as attribute in Sort-friendly URI Reordering Transform (SURT), and a VersionNode has the ISO 8601 timestamp of the version as attribute. The following illustrates the schema:

LinkGate: data scheuma

API definition and Gephi compatibility

link-serv is to receive data extracted by link-indexer from a web archive and respond to queries by link-viz as the graph representation of web resources is navigated. At this point, 2 API operations were defined for this interfacing: updateGraph and getGraph. updateGraph is to be invoked by link-indexer and takes as input a JSON representation of outlinks to be loaded into the data store. getGraph, on the other hand, is to be invoked by link-viz and returns a JSON representation of possibly nested outlinks for rendering. Additional API operations may be defined in the future as development progresses.

One of the project’s premises is maintaining compatibility with the popular graph visualization tool, Gephi. This would enable users to render web archive data served by link-serv using Gephi as an  alternative to the project’s frontend component, link-viz. To achieve this, the updateGraph and getGraph API operations were based on their counterparts in the Gephi graph streaming API with the following adaptations:

  • Redefining the workspace to refer to a timestamp and URL
  • Adding timestamp and url parameters to both updateGraph and getGraph
  • Adding depth parameter to getGraph

An instance of Gephi with the graph streaming plugin installed was used to examine API behavior. We also examined API behavior using the Neo4j APOC library, which provides a procedure for data export to Gephi.

Initial implementation

Initial minimal API service for link-serv was implemented. The implementation is in Java and uses the Spring Boot framework and Neo4j bindings.
We have the following issues up next:

  • Continue to develop the service API implementation
  • Tune insertion and matching performance
  • Test integration with link-indexer and link-viz
  • ArangoDB benchmark

Link Indexer

link-indexer is the tool that runs on web archive storage where WARC/ARC files are kept and collects outlinks data to feed to link-serv to load into the graph data store. In a subsequent phase of the project, collected data may include details besides outlinks to enrich the visualization.
We worked on the following:

  • Invocation model and choice of programming tools
  • Web Archive Transformation (WAT) as input format
  • Initial implementation

Invocation model and choice of programming tools

link-indexer collects data from the web archive’s underlying file storage, which means it will often be invoked on multiple nodes in a computer cluster. To handle future research use cases, the tool will also eventually need to do a fair amount of data processing, such as  language detection, named entity recognition, or geolocation. For these reasons, we found Python a fitting choice for link-indexer. Additionally, several modules are readily available for Python that implement functionality related to web archiving, such as WARC file reading and writing and URI transformation.
In a distributed environment such as a computer cluster, invocation would be on ad-hoc basis using a tool such as Ansible, dsh, or pdsh (among many others) or configured using a configuration management tool (also such as Ansible) for periodic execution on each host in the distributed environment. Given this intended usage and magnitude of the input data, we identified the following requirements for the tool:

  • Non-interactive (unattended) command-line execution
  • Flexible configuration using a configuration file as well as command-line options
  • Reduced system resource footprint and optimized performance

Web Archive Transformation (WAT) as input format

Building upon already existing tools, Web Archive Transformation (WAT) is used as input format rather than directly reading full WARC/ARC files. WAT files hold metadata extracted from the web archive. Using WAT as input reduces code complexity, promotes modularity, and makes it possible to run link-indexer on auxiliary storage having only WAT files, which are significantly smaller in size compared to their original WARC/ARC sources.
warcio is used in the Python code to read WAT files, which conform in structure to the WARC format. We initially used archive-metadata-extractor to generate WAT files. However, testing our implementation with sample files showed the tool generates files that do not exactly conform to the WARC structure and cause warcio to fail on reading. The more recent webarchive-commons library was subsequently used instead to generate WAT files.

Initial implementation

The current initial minimal implementation of link-indexer includes the following:

  • Basic command-line invocation with multiple input WAT files as arguments
  • Traversal of metadata records in WAT files using warcio
  • Collecting outlink data and converting relative links to absolute
  • Composing JSON graph data compatible with the Gephi streaming API
  • Grouping a defined count of records into batches to reduce hits on the API service

We plan to continue work on the following:

  • Rewriting links in Sort-friendly URI Transformation (SURT)
  • Integration with the link-serv API
  • Command-line options
  • Configuration file

Link Visualizer

link-viz is the project’s web-based frontend for accessing data provided by link-serv as a graph that can be navigated and explored.
We worked on the following:

  • Graph rendering toolkit
  • Web development framework and tools
  • UI design and artwork

Graph visualization libraries, as well as web application frameworks, were researched for the web-based link visualization frontend. Both D3.js and Vis.js emerged as the most suitable candidates for the visualization toolkit. Experimentally coding using both toolkits, we decided to go with Vis.js, which fits the needs of the application and is better documented.
We also took a fresh look at current web development frameworks and decided to house the Vis.js visualization logic within a Laravel framework application combining PHP and Vue.js for future expandability of the application’s features, e.g., user profile management, sharing of graphs, etc.
A virtual machine was allocated on BA’s server infrastructure to host link-viz for the project demo that we will be working on.
We built a barebone frontend consisting of the following:

  • Landing page
  • Graph rendering page with the following UI elements:
    • Graph area
    • URL, depth, and date selection inputs
    • Placeholders for add-ons

As we outlined in the project proposal, we plan to implement add-ons during a later phase of the project to extend functionality. Add-ons would come in 2 categories: vizors for modifying how the user sees the graph, e.g., GeoVizor for superimposing nodes on a map of the world, and finders to help the user explore the graph, e.g., PathFinder for finding all paths from one node to another.
Some work has already been done in UI design, color theming, and artwork, and we plan to continue work on the following:

  • Integration with the link-serv API
  • Continue work on UI design and artwork
  • UI actions
  • Performance considerations

Research use cases for web archive visualization

In terms of outreach, the National Library of New Zealand has been getting in touch with researchers from a wide array of backgrounds, ranging from data scientists to historians, to gather feedback on potential use cases and the types of features researchers would like to see in a web archive visualization tool. Several issues have been brought up, including frustrations with existing tools’ lack of scalability, being tied to a physical workstation, time wasted on preprocessing datasets, and inability to customize an existing tool to a researcher’s individual needs. Gathering first hand input from researchers has led to many interesting insights. The next steps are to document and publish these potential research use cases on the wiki to guide future developments in the project.

We would like to extend our thanks and appreciation for all the researchers who generously gave their time to provide us with feedback, including Dr. Ian Milligan, Dr. Niels Brügger, Emily Maemura, Ryan Deschamps, Erin Gallagher, and Edward Summers.

Acknowledgements

Meet the people involved in the project at Bibliotheca Alexandrina:

  • Amr Morad
  • Amr Rizq
  • Mohamed Elsayed
  • Mohammed Elfarargy
  • Youssef Eldakar

And at the National Library of New Zealand:

  • Andrea Goethals
  • Ben O’Brien
  • Lana Alsabbagh

We would also like to thank Alex Osborne at the National Library of Australia and Andy Jackson at the British Library for their advice on technical issues.

If you have any questions or feedback, please contact the LinkGate Team at linkgate[at]iipc.simplelists.com.

Discretionary Funding Program Launched by IIPC

By Jefferson Bailey, Internet Archive & IIPC Steering Committee

IIPC is excited to announce the launch of its Discretionary Funding Program (DFP) to support the collaborative activities of its members by providing funding to accelerate the preservation and accessibility of the web. Following the announcement to membership at the recent IIPC General Assembly in Zagreb, Croatia, the IIPC DFP aims to advance the development of tools, training, and practices that further the organization’s mission “to acquire, preserve and make accessible knowledge and information from the Internet for future generations everywhere, promoting global exchange and international relations.”

The inaugural DFP Call for Proposals will award funding according to an application process. Applications will be due on September 1, 2019 for one-year projects starting January 1, 2020 or July 1, 2020. The program will grant awards in three categories:

  • Seed Grants ($0 to $10,000) fund smaller, individual efforts, help smaller projects/events scale up, or support smaller-scope projects.
  • Development Grants ($10,000 to $25,000) fund efforts that require meaningful funding for event hosting, engineering, publications, project growth, etc.
  • Program Grants ($25,000 to $50,000) fund larger initiatives, either to launch new initiatives or to increase the impact and expansion of proven work or technologies.

The IIPC has earmarked a significant portion of its reserve funds and of income from member dues to support the joint work of its members through this program. Applications will be reviewed by a team of IIPC Steering Committee members as well as representatives from the broader IIPC membership. Our hope is that the IIPC DFP serves as a catalyst to promote grassroots, member-driven innovation and collaboration across the IIPC membership.

Please visit the IIPC DFP page (http://netpreserve.org/projects/funding/) for an overview of the application process, links to the application form and a FAQ page, and other details and contact information. We encourage all IIPC members to apply for DFP funding and to coordinate with their peer member on brainstorming programs to advance the field of web archiving. The DFP team intends to administer the program with the utmost equity and transparency and encourages any members with questions not answered by online resources to post them on the dedicated IIPC Slack channel (#projects at http://iipc.slack.com) or via email projects[at]iipc.simplelists.com.